Public Opinion About Psychedelics
Experiment Overview
Within this national survey, we also embedded an experiment that tested how different variations of policy proposals can affect the level of public support for the policy. Using the tabs you can see the results of the experiment as well as which factors influence people to support or oppose.
Design of the Experiment
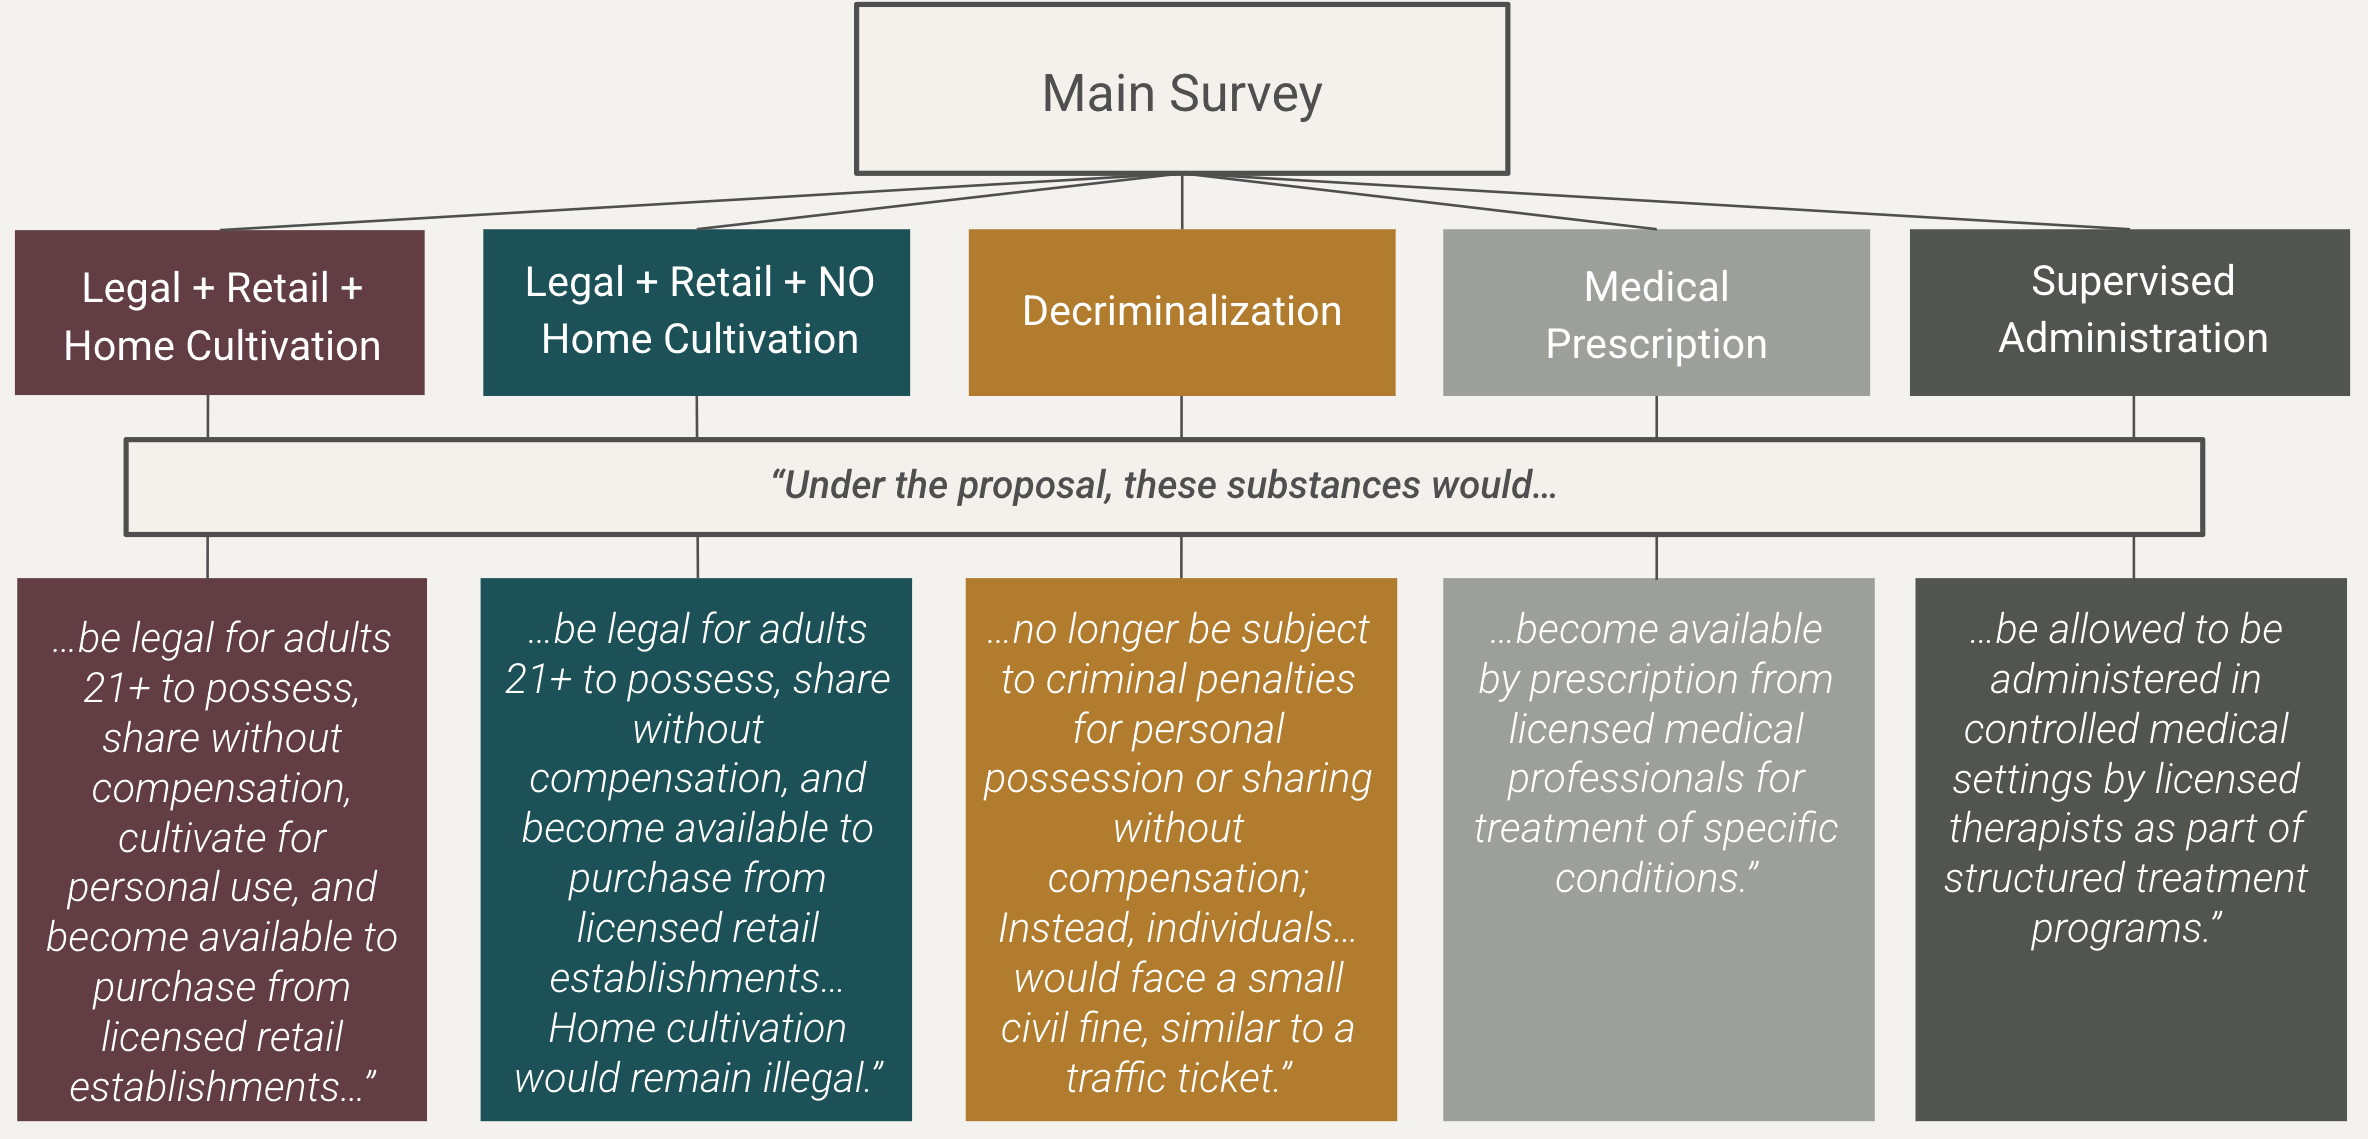
In this experiment, the survey participants were randomly assigned to see one of five types of policies, with each described as being under consideration in their home state. The five policy descriptions differed in their specific details—ranging from decriminalization to medical uses to full legalization for adult use. The wording and content was designed to mimic common types of state ballot measures in the U.S. See the key wording differences in the figure below
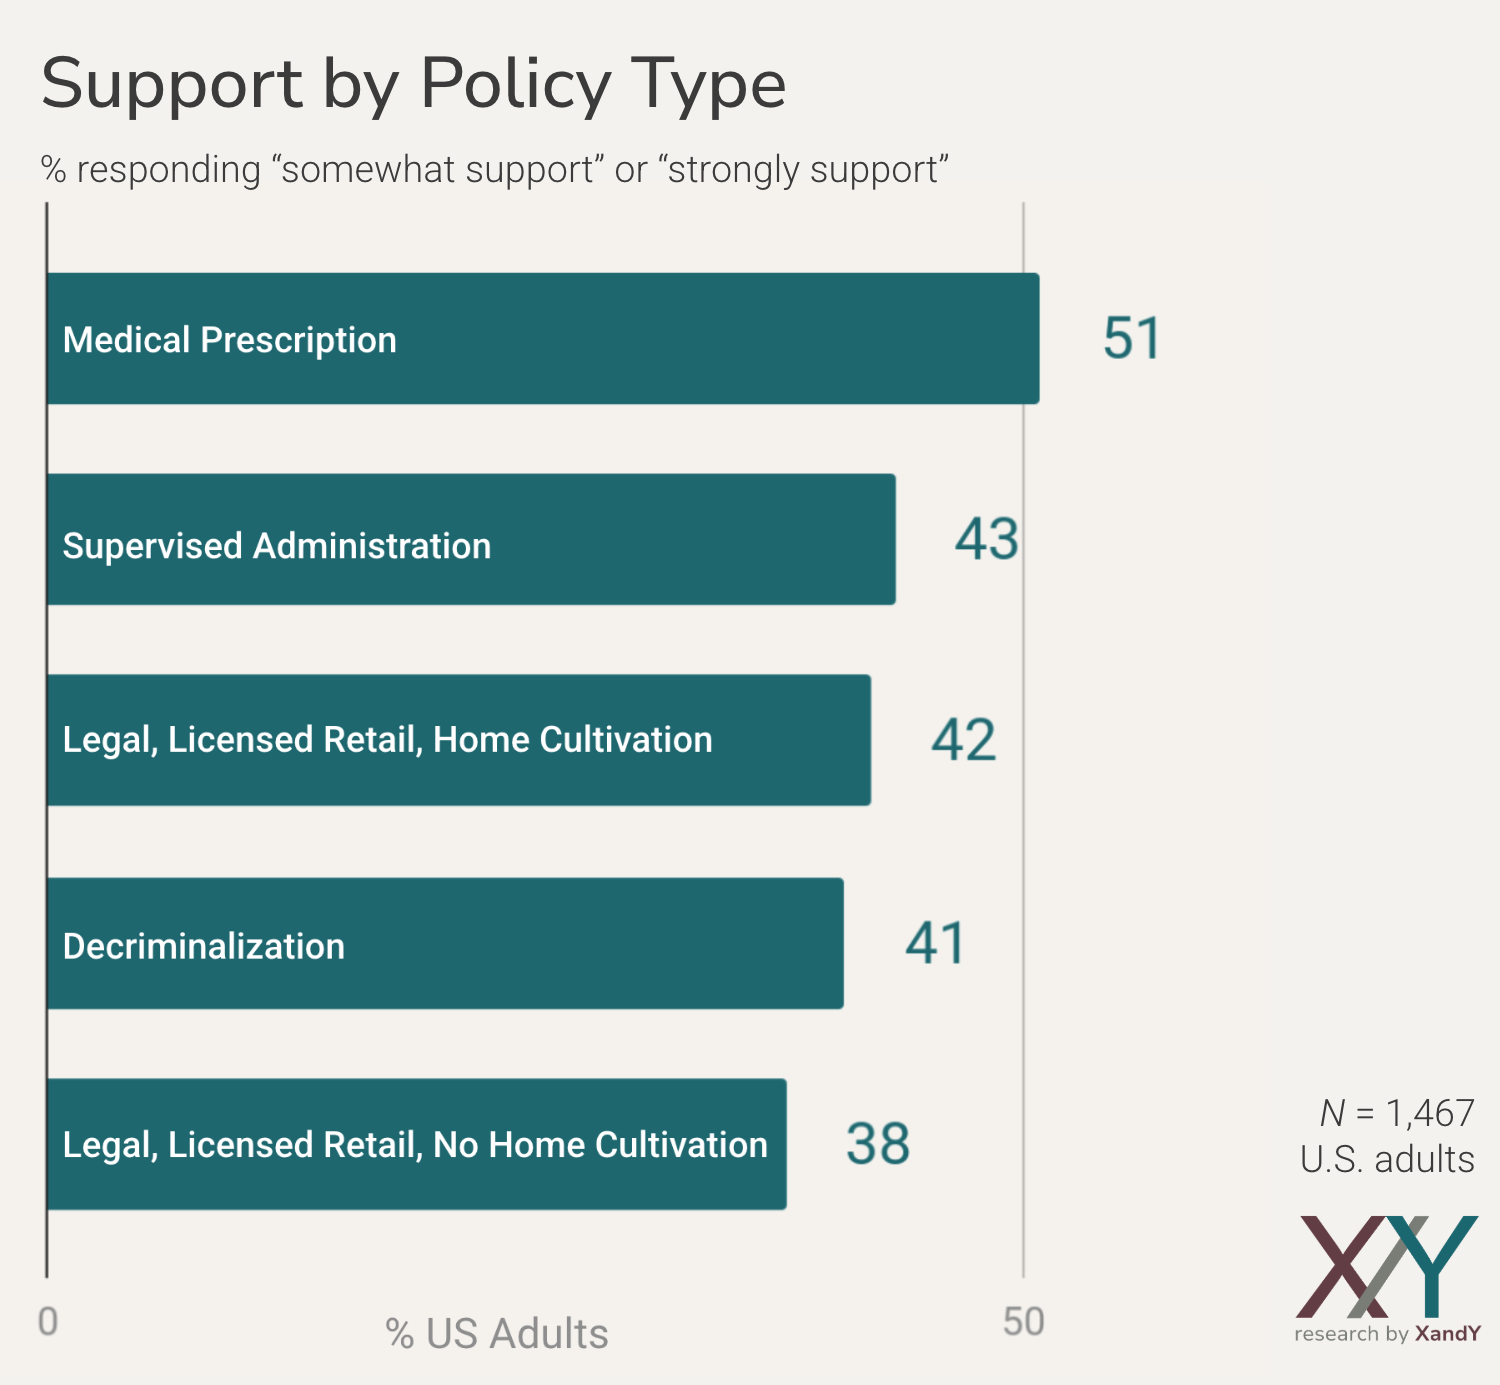
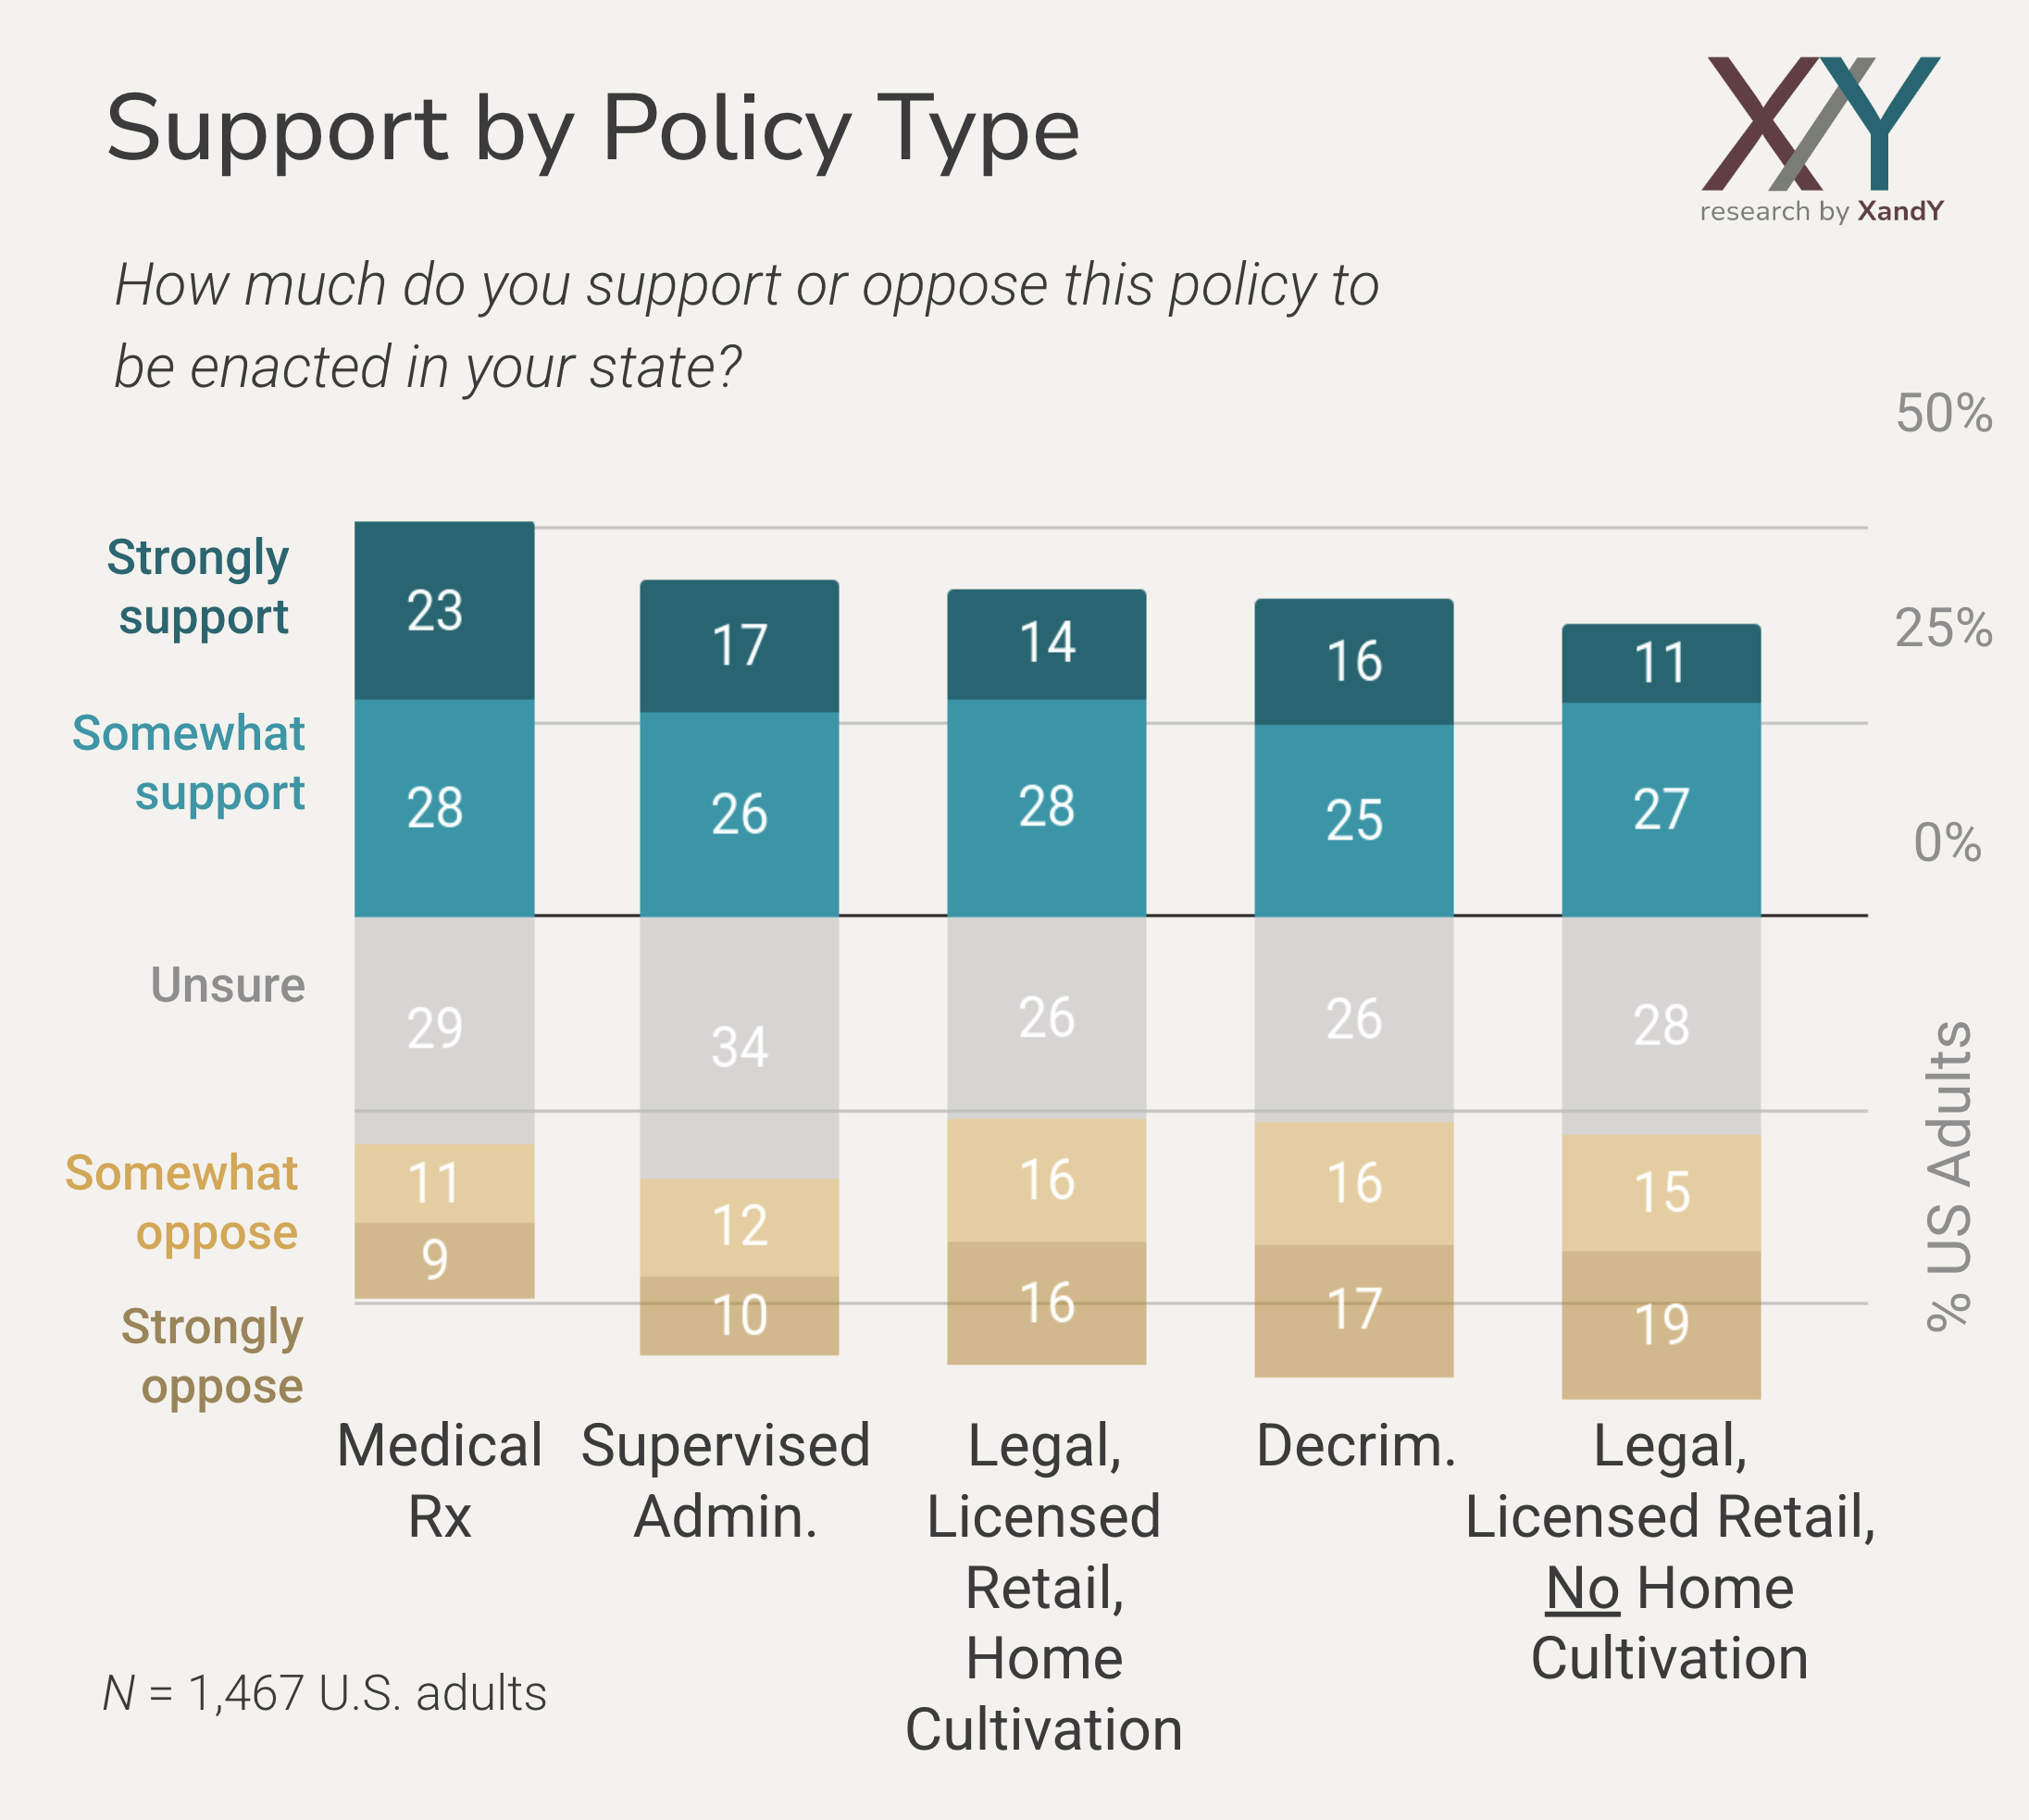
After reading about their assigned policy, each participant was asked to indicate their level of support or opposition for the policy that they read. By comparing the responses across the different experimental groups, we can see how support increases or decreases depending on which type of policy is proposed. These results are shown in the “Overall Support” tab and the “Strength of Support” tab.
Reasons for Support or Opposition
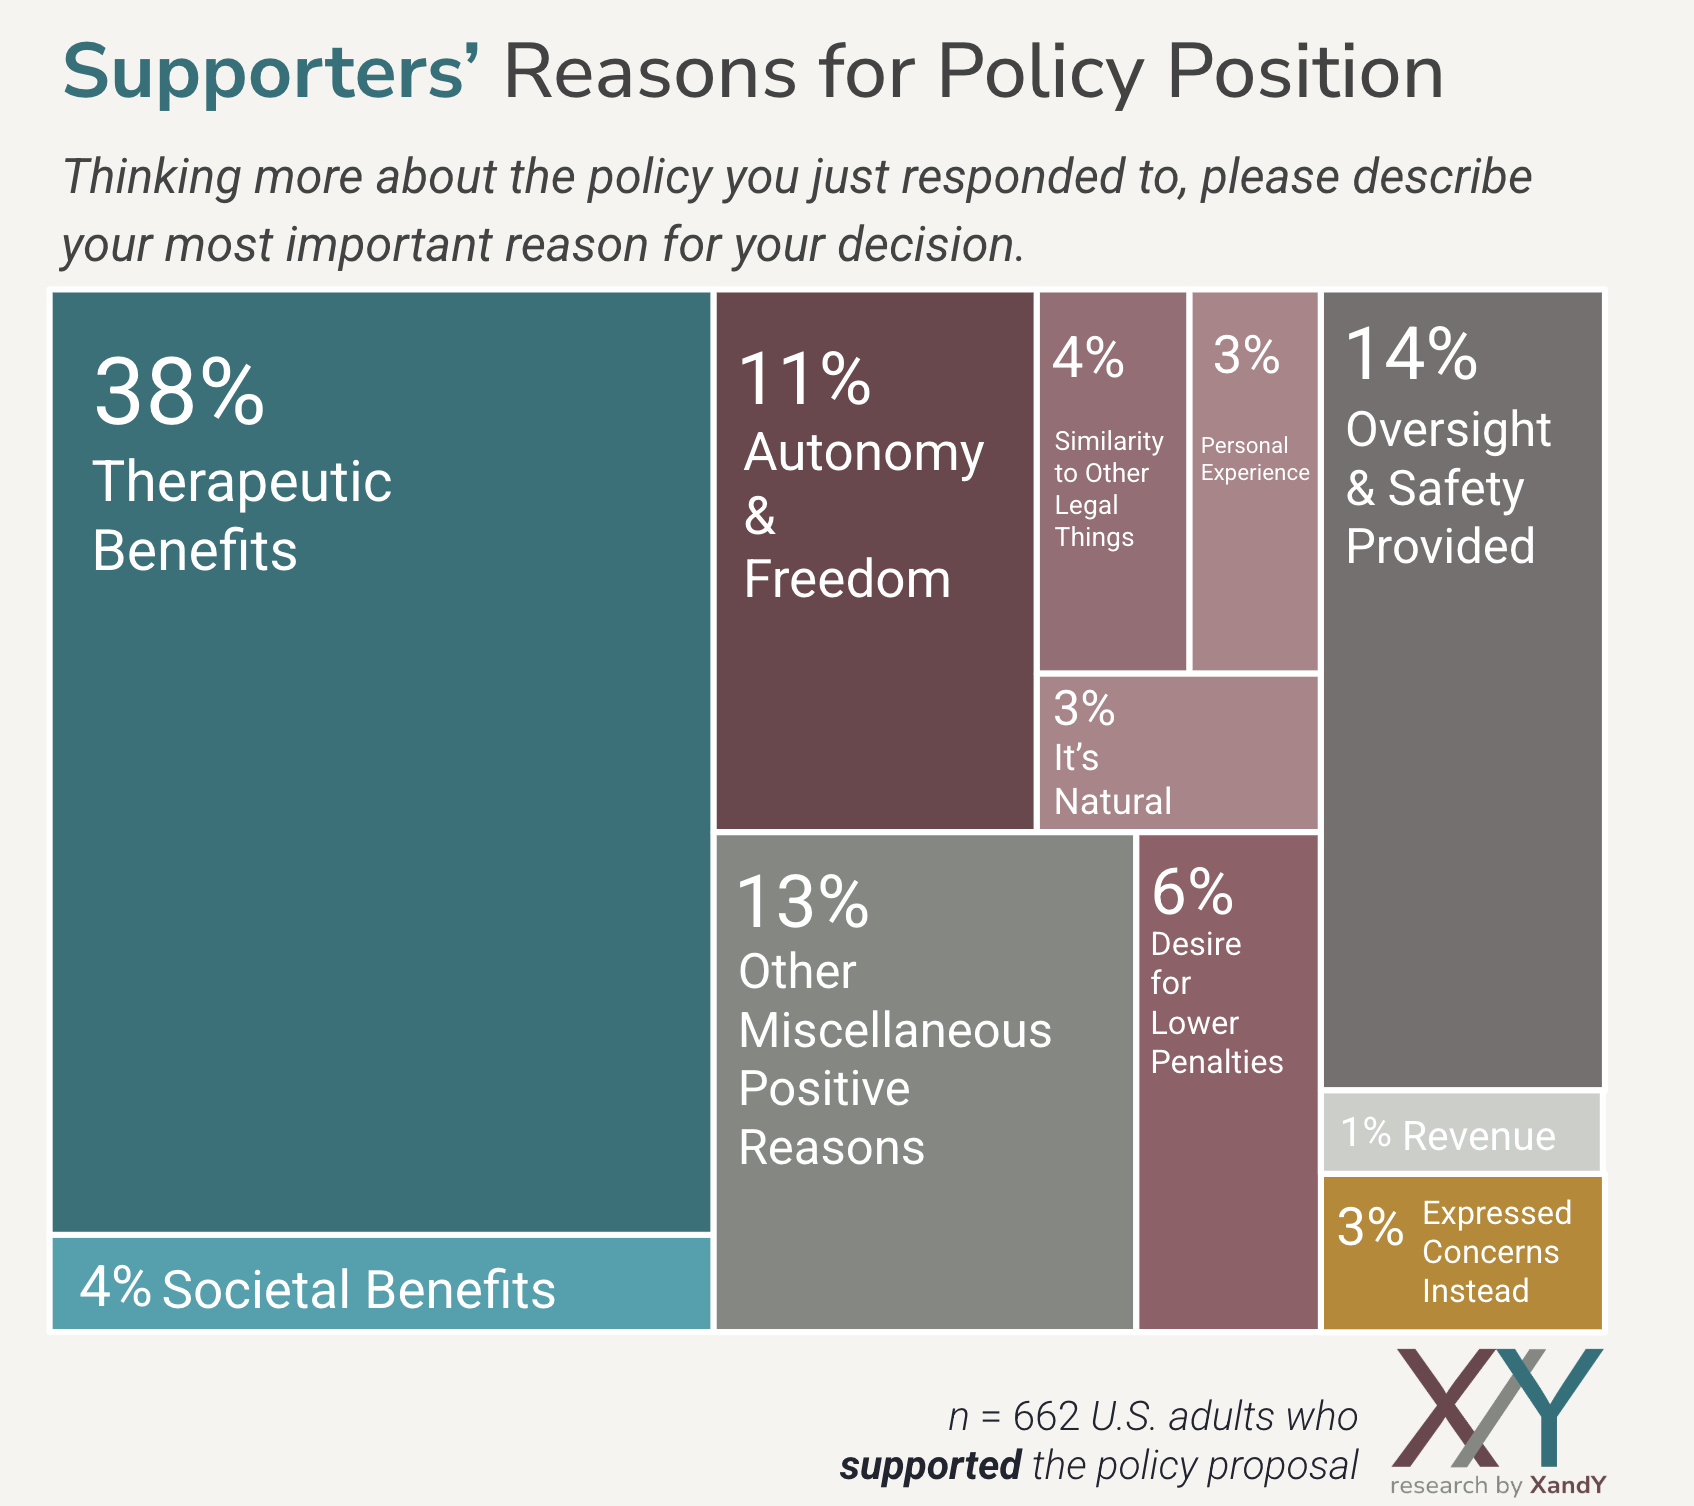
After indicating their level of support or opposition, participants were then asked an open-ended question in which they wrote a brief rationale for their position on the proposed policy. After reading through all of the responses, we developed a categorization system that shows the main themes or topics—and which are most or least common. In the “Reason for Position: Open Response” tab we present the results grouped separately by those who supported, opposed, and were neutral toward the policy.
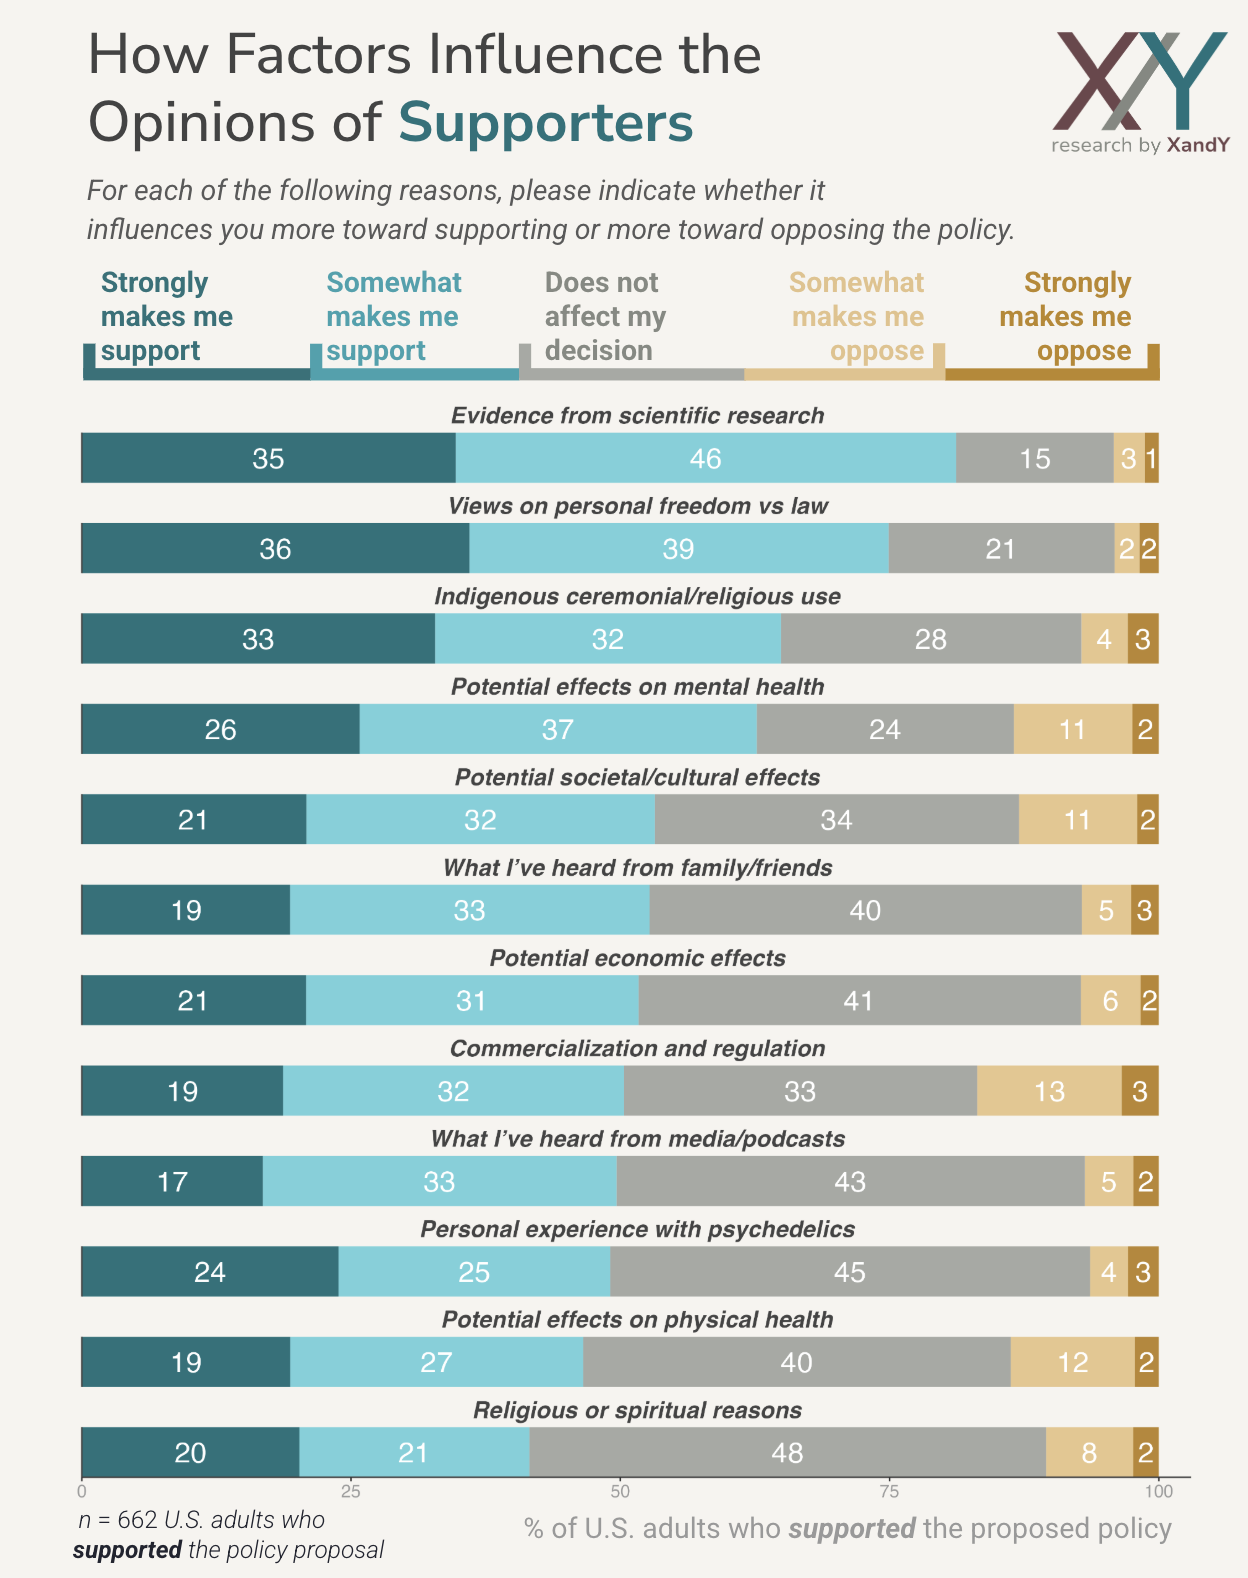
Lastly, participants answered questions about how much different factors (e.g., scientific evidence, potential mental-health effects) influenced them to support or oppose the policy proposal. In the “Reason for Position: Closed Response” tab we present the results grouped separately by those who supported, opposed, and were neutral toward the policy.
Together, this experiment enables us to see which types of policies are met with the greatest support and, importantly, the reasons underlying people’s opinions.
Survey and App Design
The design, content, analysis, and reporting of this survey were produced by Matthew Goldberg, Abel Gustafson, Carly Wolfer, and Kyle Gustafson. The survey was administered in the Alchemer online survey environment. This app was developed by Matthew Goldberg and Gagan Atreya.
Sampling
Data collection was conducted by XandY from April 24–25, 2025 using online recruitment methods to sample adult residents of the United States (N = 1,467). This survey used a nested quota sampling strategy to match U.S. Census proportions of age, income, race and ethnicity, geographic region, gender, and political party affiliation. To further ensure the insights reported from this sample closely resemble the U.S. population, the sample was weighted to match U.S. Census benchmarks.
Margin of Error
Proportion statistics regarding the full national sample have an average margin of error of +/- 3 percentage points at the 95% confidence level. The margin of error in subgroups is determined by the subgroup size.